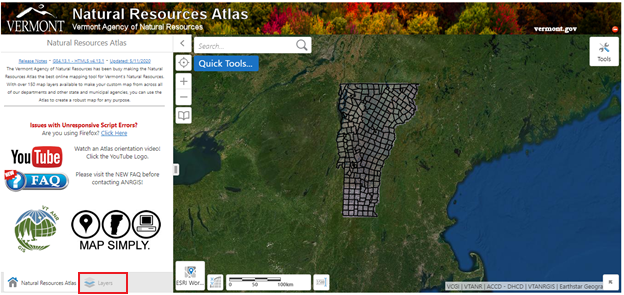
- Navigate to the ANR Atlas.
-
In the column on the left, select the [Layers] tab on the bottom.
-
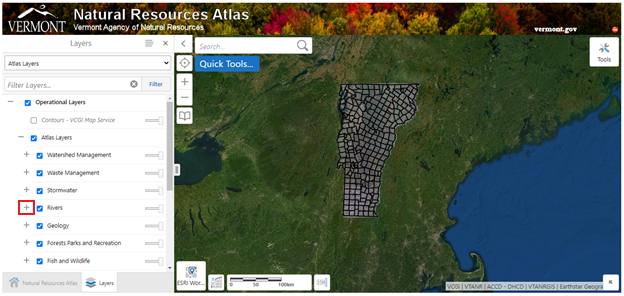
Select the [+] next to the [Rivers] title to expand the section.

-
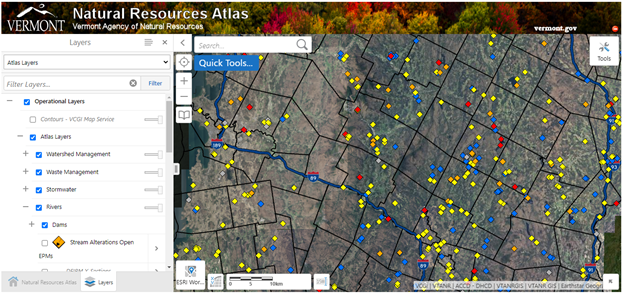
Select the empty box next to [Dams] to activate this layer. When you zoom in, you will be able to see the dams in VDI projected on the map. Each point is a dam, with the color corresponding to the hazard potential classifications. Yellow is LOW Hazard, Orange is SIGNIFICANT Hazard, Red is HIGH Hazard, and Blue is a Historical Dam Location where a dam once was.
-
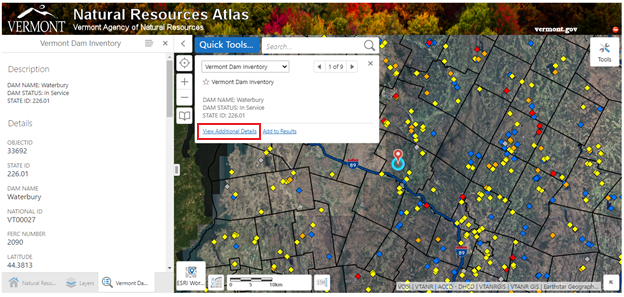
Select a point to see the name on the dam and select [View Additional Details]. You can then scroll down in the column on the left to view information stored in the VDI.