The data summary graphs listed below demonstrate how Vermont's air quality compares to the National Ambient Air Quality Standards (NAAQS). These data summary graphs show the trends relative to the NAAQS through 2023 and are updated on a yearly basis.
Ozone (O3) 8-Hour Average
Value for each year is the average of the EPA design value* for the previous three-years.
Reference: EPA Design Value Report AMP480 11/1/2024
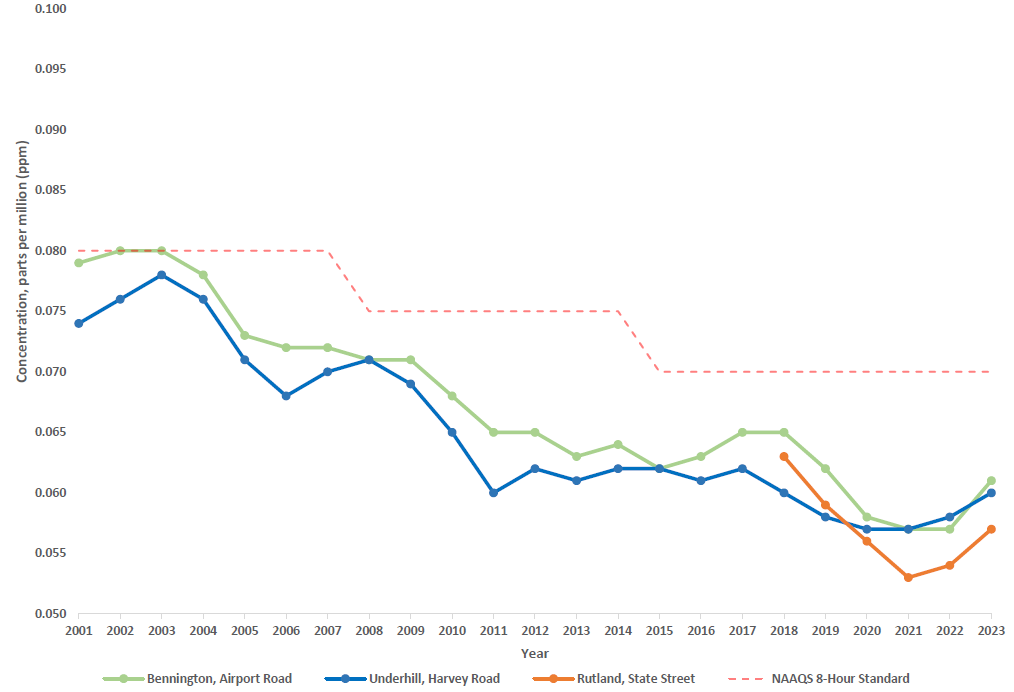
*Annual fourth-highest daily maximum eight-hour concentration
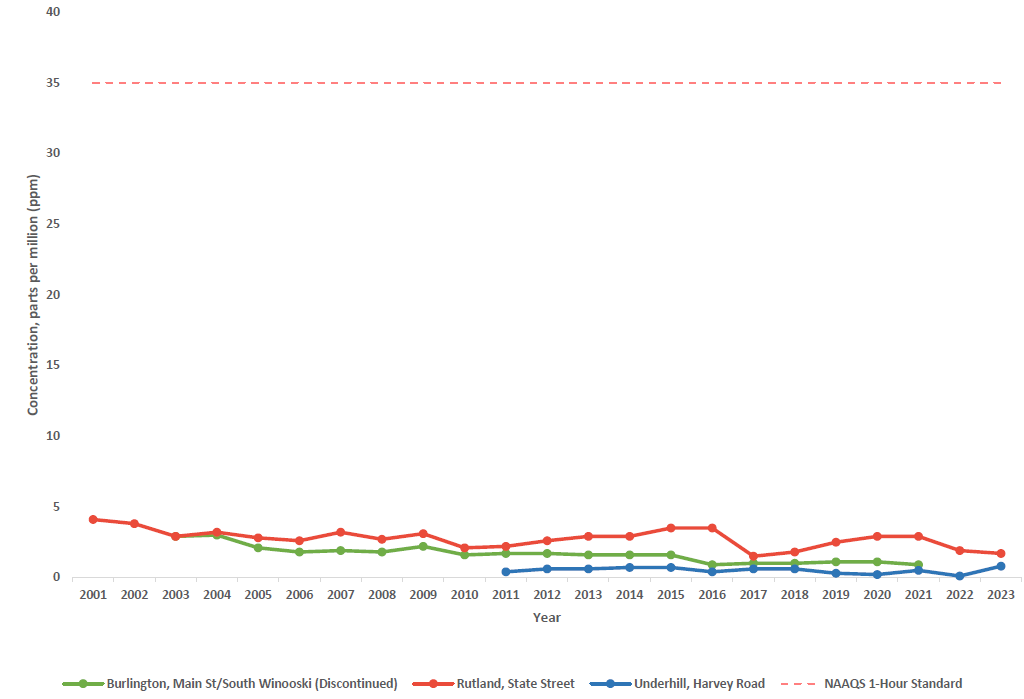
Carbon Monoxide (CO) Second Max. 1-Hour Average
One-Hour average NAAQS, accessed relative to the annual second maximum one-hour average.
Reference: EPA QuickLook Report AMP450 11/1/2024
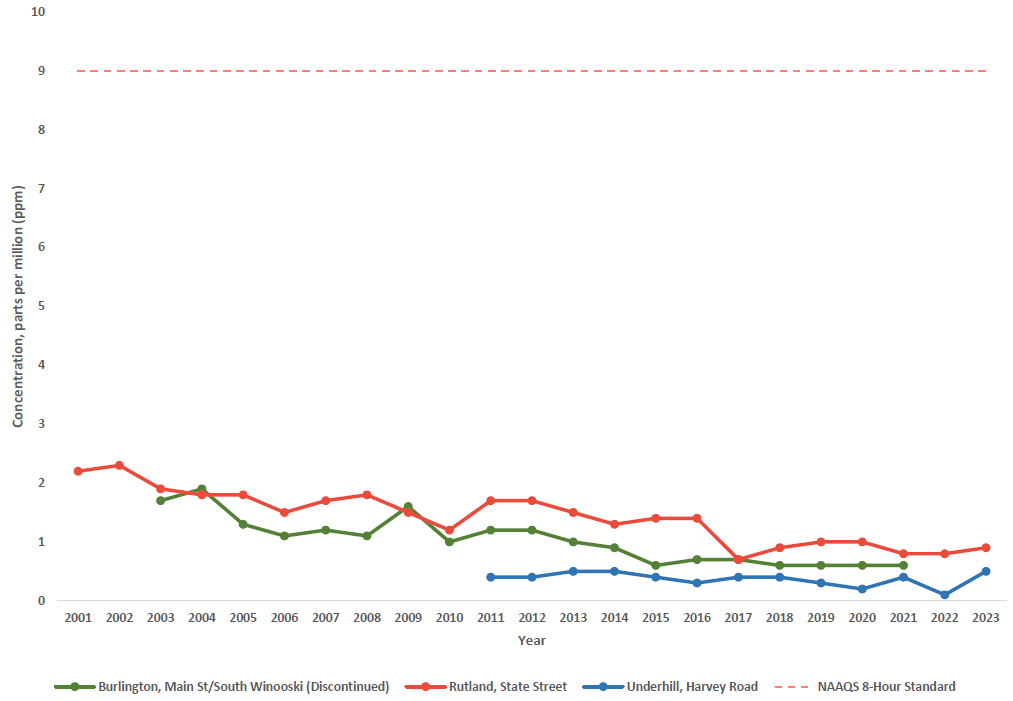
Carbon Monoxide (CO) Second Max. 8-Hour Average
Eight-hour average NAAQS, accessed relative to the annual second maximum eight-hour average.
Reference: EPA QuickLook Report AMP450 11/1/2024
Nitrogen Dioxide (NO2) 1-Hour Average
Value for each year is the average of the EPA design value* for the previous three-years.
Reference: EPA Design Value Report AMP480 11/1/2024
*98th percentile of one-hour daily maximum concentrations
Nitrogen Dioxide (NO2) Annual Average
Annual average NAAQS, accessed value for each year is the average of the one-hour averages.
Reference: EPA Quicklook Report AMP450 11/1/2024
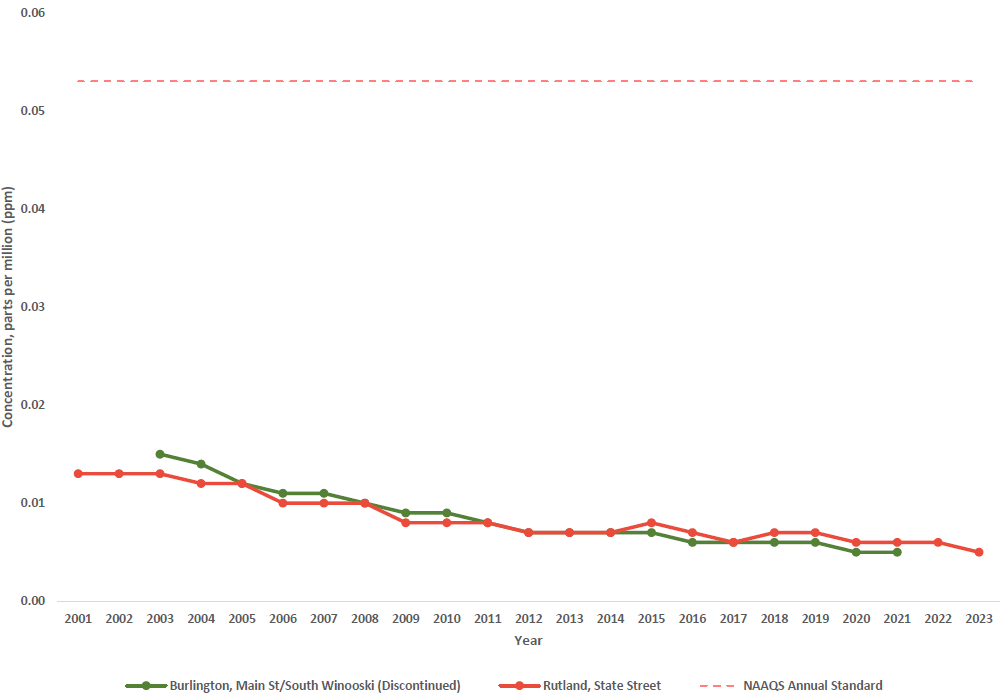
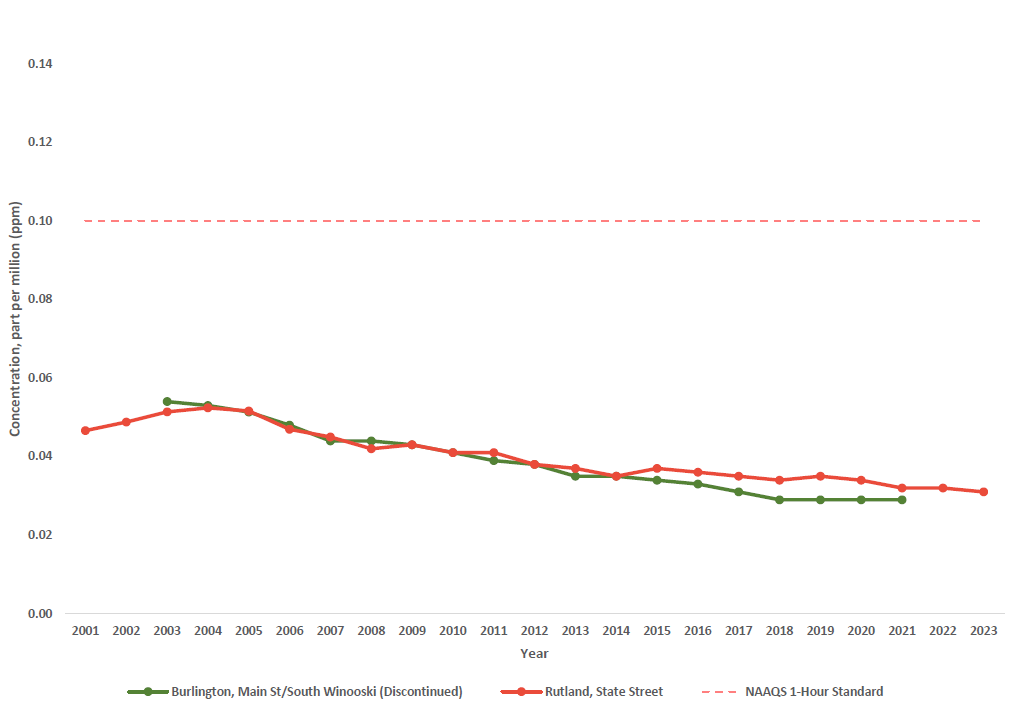
Sulfur Dioxide (SO2) 1-Hour Average
Value for each year is the average of the EPA design value* for the previous three-years.
Reference: EPA Design Value Report AMP480 11/1/2024

*Annual 99th percentile one-hour average.
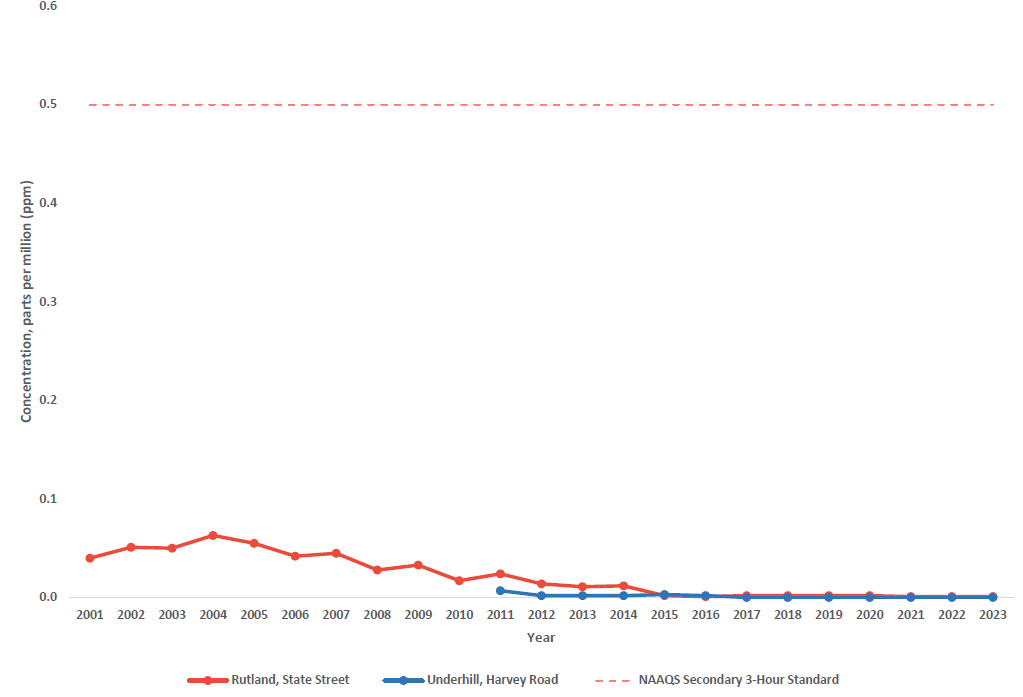
Sulfur Dioxide (SO2) Second Max. 3-Hour Average
Three-hour average secondary NAAQS, assessed relative to the annual second maximum three-hour block average of one-hour
Reference: EPA Reduced Frequency Report AMP260 11/1/2024
Fine Particulate (PM2.5) Annual Average
Annual averages for 2001-2014 are based on filter-based samples collected every three days. Annual averages for 2015-2023 are based on continuous one-hour averages. Annual averages presented for each year are the average of EPA design values* for the previous three-years.
Reference: EPA Design Value Report AMP480 11/1/2024
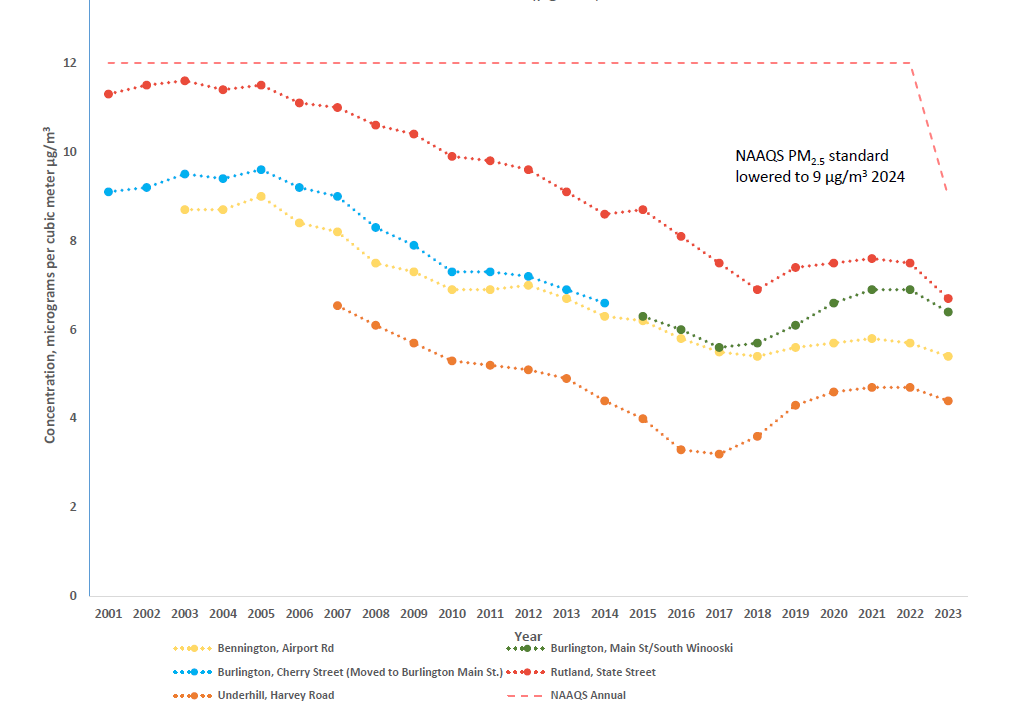

*Annual mean, averaged over 3 years
Fine Particulate (PM2.5) 24-Hour Average
Twenty four-hour averages for 2001-2014 are based on filter-based samples collected every three days. Twenty four-hour averages for 2015-2022 are based on continuous one-hour averages. Twenty four-hour averages presented for each year are the average of EPA design values* for the previous three-years.
Reference: EPA Design Value Report AMP480 11/1/2024
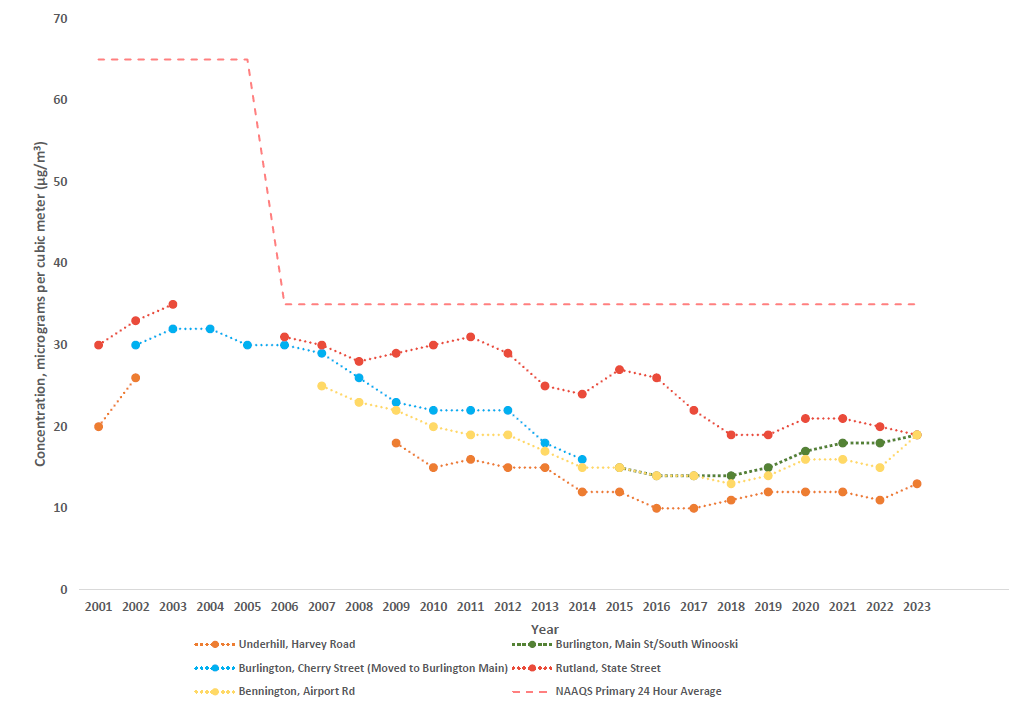
*Three-year average of the annual 98th percentile twenty four-hour average.