Radon is a colorless, odorless, and tasteless gas that forms naturally from the radioactive decay of uranium in rocks, surficial materials, and soils over millions of years. After formation, radon can move through fractures and layering in rocks or through connected pores in surficial materials and soils and enter a home through the foundation. Exposure to radon in indoor air is estimated by the Environmental Protection Agency (EPA) to be the second leading cause of lung cancer, with smoking being the first. The EPA action level for radon in indoor air is 4 picocuries/ liter. More information on the health aspects of radon and mitigation strategies is available through the Vermont Dept. of Health (VDH). VDH has collected radon data for decades and developed an interactive web site for radon in Vermont.
Since 2009, the Vermont Geological Survey and VDH have collaborated to understand the relationship between radon levels in indoor air and geology. Although the resulting maps give a general indication of the bedrock zones that have higher radon levels, everyone should test the indoor air in their home(s) for radon.
VGS Open File Report VG2019-2: Bedrock Zones in Vermont and Radon in Air Test Points and Statistics
Bedrock Zones in Vermont and Radon-in-Air Tests (VGS Open File Report VG2019-2) summarizes the results of the radon work with the VDH. The bedrock zones are simplified from the 2011 Bedrock Geologic Map of Vermont and represent rocks of similar age and geologic history; the zones were joined with 14,131 radon test data in GIS. Read me file.
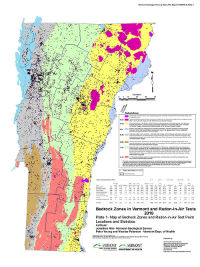
Plate 1, Map of Bedrock Zones and Radon-in-Air Test Point Locations and Statistics, shows the extent of bedrock zones, the locations of all radon tests, and has a table that shows radon statistics for all bedrock zones. The table includes average, median, high, and low radon levels. In addition, statistics are shown for percentage of tests that: A) equal or exceed 4 picocuries/liter, B) are between 0 – 2 picocuries/liter, C) are between 2-4 picocuries/liter, D) are between 4-10 picocuries/liter, E) are between 10-20 picocuries/liter, and F) are greater than 20 picocuries/liter.
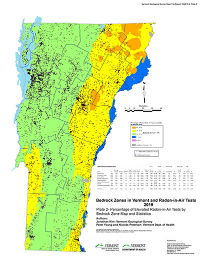 Plate 2, Percentage of Elevated Radon-in-Air Tests by Bedrock Zone Map and Statistics, shades the bedrock zones according to the percentage of tests that equal or exceed 4 picocuries/liter and has the same table as Plate 1. The percentage categories are arbitrary and divide the percentage range of elevated tests into five groups, with one group representing the bedrock zone that had less than 10 radon tests (n=1). A simple description of this map is that the Precambrian basement, Green Mountain, and Champlain valley zones cluster around the statewide elevated radon average of 13%, whereas the Taconic, Connecticut Valley, and Devonian Granites zones have higher percentages of elevated tests and the Bronson Hill Zone has a lower percentage of elevated tests.