The Lake Champlain Long-Term Water Quality and Biological Monitoring Project (LTMP) is supported by the Lake Champlain Basin Program (LCBP) and is conducted in partnership with LCBP, Vermont Department of Environmental Conservation, New York Department of Environmental Conservation, and SUNY Plattsburgh. The project is designed to measure overall ecosystem health of Lake Champlain based on key ecosystem indicators and to assess long-term effects of management actions and other environmental changes.
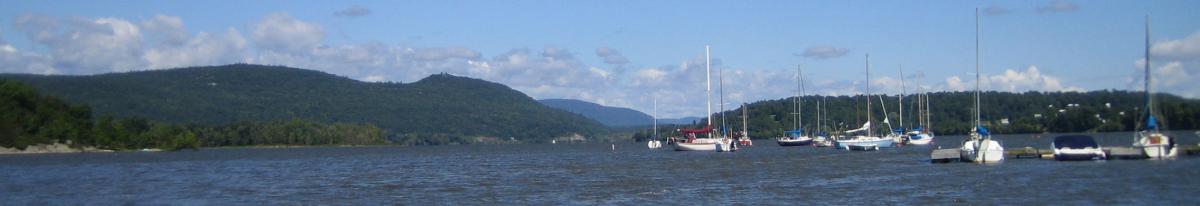
Lake Champlain is one of the largest freshwater lakes in the United States. It is an ecologically diverse system that serves as a major recreational hub and a drinking water source. Like many large lakes, it receives municipal and industrial wastes as well as runoff from agricultural and urban areas, all of which contribute to recognized water quality problems within the lake and watershed. 

Project History
Monitoring Activities
Data and Documents
Project History
The LTMP grew from the Lake Champlain Diagnostic-Feasibility Study conducted by Vermont DEC and New York State DEC from 1990-1991. The study focused primarily on the measurement of phosphorus and chloride concentrations in the lake and its tributaries to develop a phosphorus loading budget and mass balance model for Lake Champlain. The present long-term monitoring project continued sampling a subset of the lake and tributary station network established in 1992 and extended the program to include a broader range of chemical and biological measurements. One of the original purposes of the program was to provide a current limnological survey of Lake Champlain, including a data set that would support the development of hydrodynamic, eutrophication, and food web models for the lake. The primary purpose of the project was redefined in 1995 to be the detection of long-term environmental change in the lake, and the sampling program focused on those analyses determined to be the most meaningful for assessing the long-term effects of management actions and other changes in the environment.
In 2006, the Lake Champlain Basin Program began to incorporate the concept of “ecosystem indicators” into its management strategies. Criteria for these indicators require that they be ecologically and socially relevant, measurable, statistically sound, and interpretable. Changes to the monitoring program were implemented to more closely align sampling activities with ecological indicators selected to provide quantifiable measures of overall ecosystem health.
Monitoring Activities
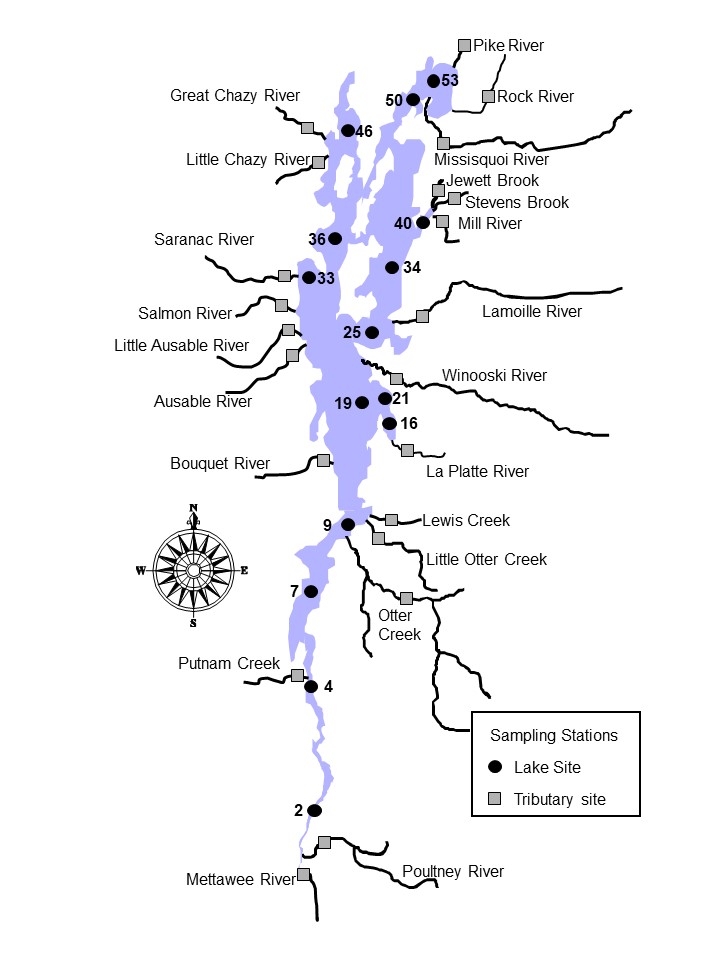
 The monitoring network includes 15 lake stations representing major lake segments with distinct physical and water quality characteristics. The program also monitors 21 major tributaries to the lake, all of which have continuous stream flow gauges in operation. The exceptions are the large LaChute Creek watershed (702 km2) in New York, which does not have a gauge, and the Putnam Creek which has been monitored in the past, but lack of funding caused monitoring to cease in 2015. Monitoring staff from both Vermont and New York are responsible for sample collection.
Lake Monitoring
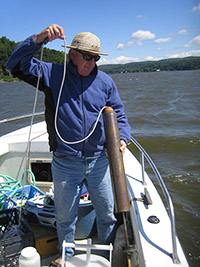
Lake stations are visited regularly from late April through October each year. Samples are collected for most chemical tests using Kemmerer or Van Dorn water bottle devices, with samples from discrete depths combined to form a vertical water column composite. When thermal stratification exists, separate composite samples are obtained from both the warmer upper waters (the epilimnion) and the colder deep waters (the hypolimnion).
Temperature, oxygen, conductivity and pH are measured in vertical profiles using multi-probe sonde technology. Chlorophyll and phytoplankton are integrated composite samples taken from the photic zone, the upper layer of water that receives enough light for photosynthesis. Zooplankton, including rotifers, are sampled using a plankton net towed vertically from just above the sediments to the water surface. Mysids, large invertebrates that serve as an important food source for fish, are sampled using a bongo net towed through the water column. Zebra mussel veligers are sampled with plankton nets while polyvinyl chloride settling plate arrays are used to assess numbers of juvenile zebra mussels. Monitoring program staff also watch for cyanobacteria blooms and regularly provide information about these algae for the Vermont Department of Health’s interactive map of algae conditions on the lake.
Tributary Monitoring
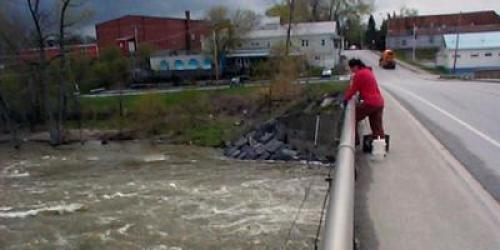
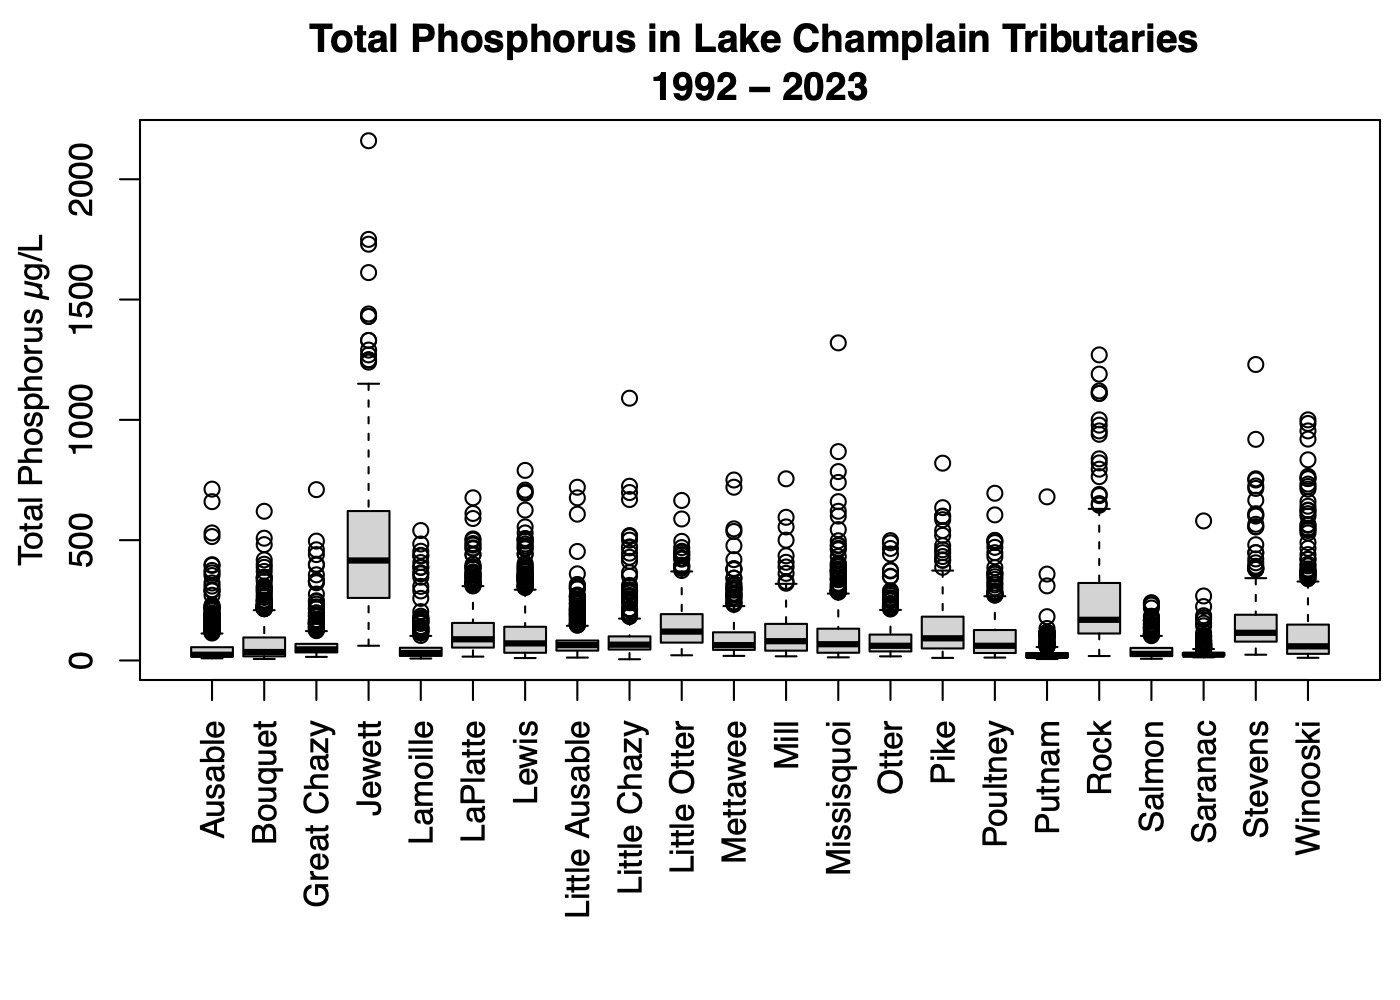
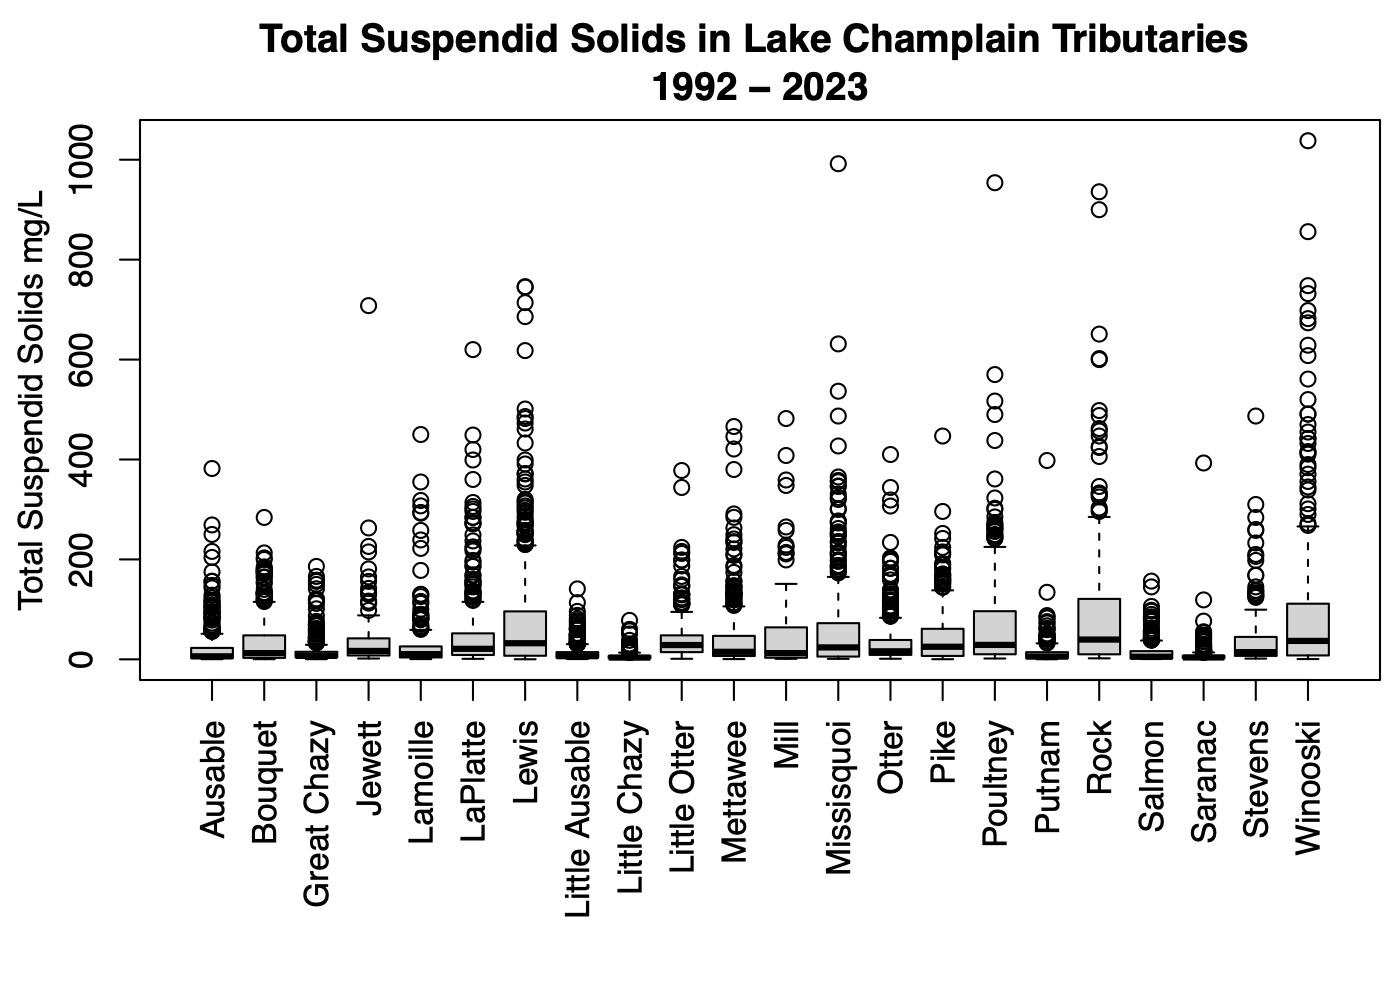
Tributary samples are obtained under a full range of flow conditions each year, but with a strong emphasis on high flow conditions in order to improve the precision of annual mass balance loading estimates for phosphorus. Twelve or more samples are obtained for most parameters, with additional collections made solely for phosphorus. Sites are located at bridge crossings as near as possible to the river mouths. Depth and velocity integrated samples are obtained using specialized samplers.
Estimated actual annual and flow-normalized loads and their trends in Lake Champlain tributaries are presented in a 2019 report issued by the Lake Champlain Basin Program: Concentration, load, and trend estimates for nutrients, chloride, and total suspended solids in Lake Champlain tributaries,1990 – 2017. More recent tributary loading estimates are available upon request.
For additional monitoring data or information contact Kelsey Colbert (VTDEC).
Data and Documents
The Lake Champlain Basin Program, the Clean Water Initiative, and the Vermont Department of Health, among others, use data generated through the Long-Term Water Quality and Biological Monitoring Program to identify water quality issues of concern and assess progress in reducing lake pollution. Program data are also used for the Lake Champlain Basin Program to produce State of the Lake Reports and technical reports on trends in lake phosphorus concentrations and tributary loadings.