 Macroinvertebrate Sample Collection
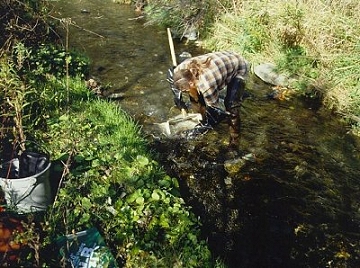 Biologists in the Biomonitoring and Aquatic Studies Section (BASS) monitor the health of Vermont's aquatic environment through macroinvertebrate and fish communities. Methods used to collect and process aquatic macroinvertebrates are documented in Section 6.5 of the Field Methods Manual (2022). All macroinvertebrate samples are collected during the late-Summer, early fall index period, from September to mid-October. A two-person field crew selects a representative section of the stream reach to be sampled. Physical characteristics recorded at each site include: stream width; depth; water velocity; water temperature; specific conductance; weather conditions; substrate composition; substrate embeddedness (riffle sites only); canopy cover; stream bank condition and immediate upstream land use.. Water chemistry is collected for pH, alkalinity, conductivity, color, nutrients and metals to help determine stream characterization and type.
Sample Processing & Data Management
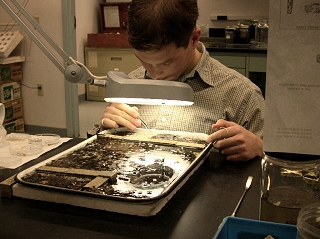 All methods used to process aquatic macroinvertebrate samples are documented in Section 6.5 of the Field Methods Manual (2022). All sample processing is done in a laboratory setting. Processing includes picking organisms from the sample, sorting the organisms into taxonomic groups, identifying organisms to lowest possible taxonomic level, and entering data into the data management system.
All organisms are subsequently identified to the lowest practicable taxonomic level by staff specializing in a specific macroinvertebrate order. A full description of the Vermont macroinvertebrate biocriteria can be found in the Biocriteria for Fish and Macroinvertebrate Assemblages in Vermont Wadeable Streams and Rivers. The data management system normalizes all abundance data to a standard sampling effort to account for variations in sub-sampling procedures. The data management system calculates and reports the mean percent composition and density of all taxa, the standard error (based on the mean of two replicates) of all taxon abundance estimates, the functional group percent composition, and a wide range of community biometrics for each sampling event in a sample summary report. From this table a site summary report is generated, which includes all sampling events from a site over time. For biomonitoring site results for individual streams or rivers, see the Macroinvertebrate Site Summary Tables on the Vermont Integrated Watershed Information System.