Welcome to Vermont's Real-Time Air Quality Data
Visit Real Time Data
Things to note when looking at the Real-Time data: The Home Page displays a map of Vermont with the stationary monitoring site locations indicated by color coded boxes and links to various graphical data for the past 5 days
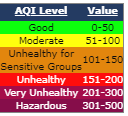
The number in the box represents the most recent hour's AQI value for each site. The background color of the box is based on the EPA AQI value. (i.e. green=good).
|
Hovering the cursor over the site box will display all of the most recent hour's pollutants values. The “Responsible Pollutant” is listed at the top and is the pollutant currently defining the calculated AQI the current highest relative concentration.
The site boxes are also links. Click on a site box to bring up the Site Display page. *Note: To go back to the main page, use the back button under the ‘Site Display’ title, or use your browser’s back button.
- The "Layers" drop-down menu above the map can be used to select and display the most recent ambient air concentration of pollutants monitored at the sites (not all pollutants are monitored at all sites).
- The Site Display page shows the physical site address, a picture of the site monitoring trailer, and a list of parameters measured at that site.
- The table at the bottom of this Site Display page shows the AQI values for the past 6 hours, and the responsible pollutant that is defining the AQI for that hour.
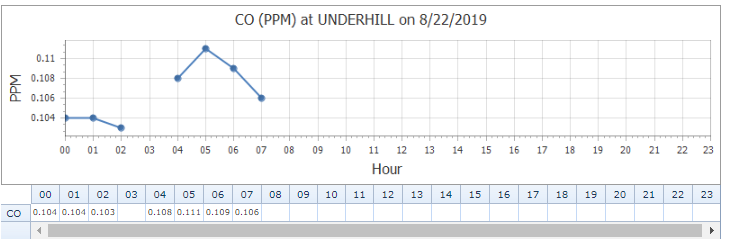
- Below the site picture is a link to Real-Time & Historical Data Concentration. This opens a page with real-time graphical & tabular views of today’s hourly data at that site. Past days can be viewed by selecting a different date at the top of the page and clicking ‘Load.’ (*Note: Hit the back button in the web browser to go back to the Site Display page.)
 |
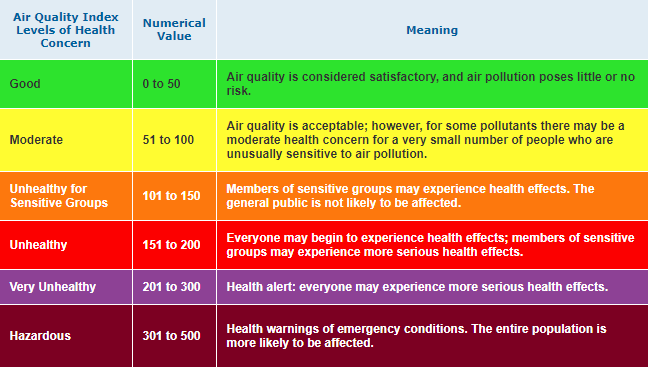
AQI is the “Air Quality Index.” It tells how clean or polluted the ambient air is, and what associated health effects might be of concern. The AQI focuses on short term health effects. The EPA calculates the AQI for five major air (Criteria) pollutants regulated by the Clean Air Act: ground-level ozone, particle pollution (also known as particulate matter), carbon monoxide, sulfur dioxide, and nitrogen dioxide. AQI is defined in detail at the AirNow.gov website |
 |
Air quality affects how you live and breathe. Like the weather, it can change from day to day, or even hour to hour. Up-to-date information allows you to make decisions based on air quality forecasts. EnviroFlash comes to you through a partnership between the US EPA and your state or local air quality agency - notifying you about air quality so you don't have to go searching for it! To sign up and receive daily email alerts on Air Quality Index. |